Blog
Introducing VectoredIn: A New Dimension in Job Market Analysis
By Nick Barlow
Welcome to VectoredIn! It aims to provide a powerful tool for analyzing and visualizing job market data using Weaviate.
See it live! https://app.nbdata.co
Project Overview
VectoredIn is a web application that allows users to explore and gain insights from job market data. It leverages the power of natural language processing (NLP) and machine learning techniques to process and analyze job listings.
Features
3D Plot of Semantic Distance
Here’s an example of the 3d Scatterplot.
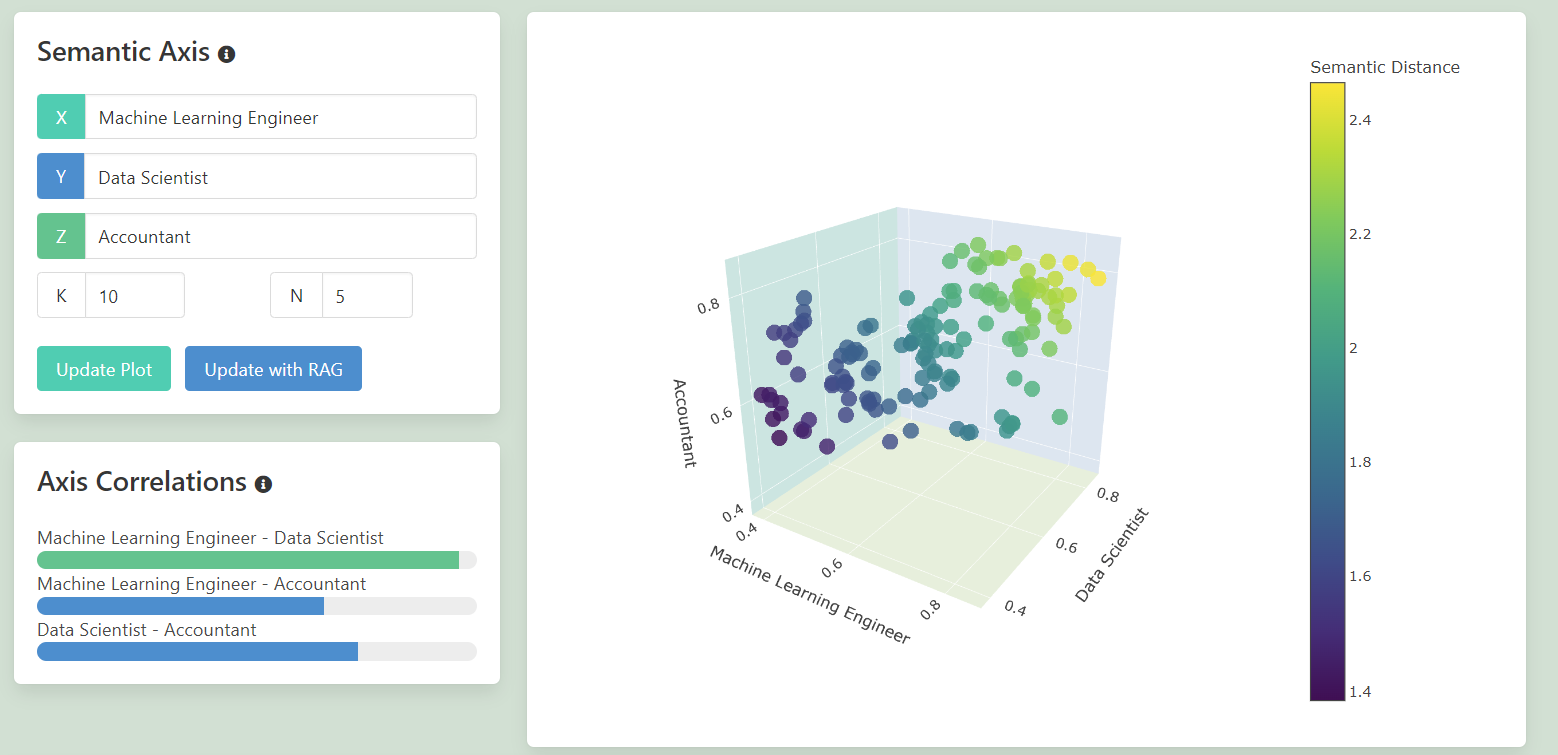
On the left hand side is where the 3 axis are set, which can be adjusted and the plot updated. Below that show’s the linear correlation between the 2d permutations between the 3 axis.
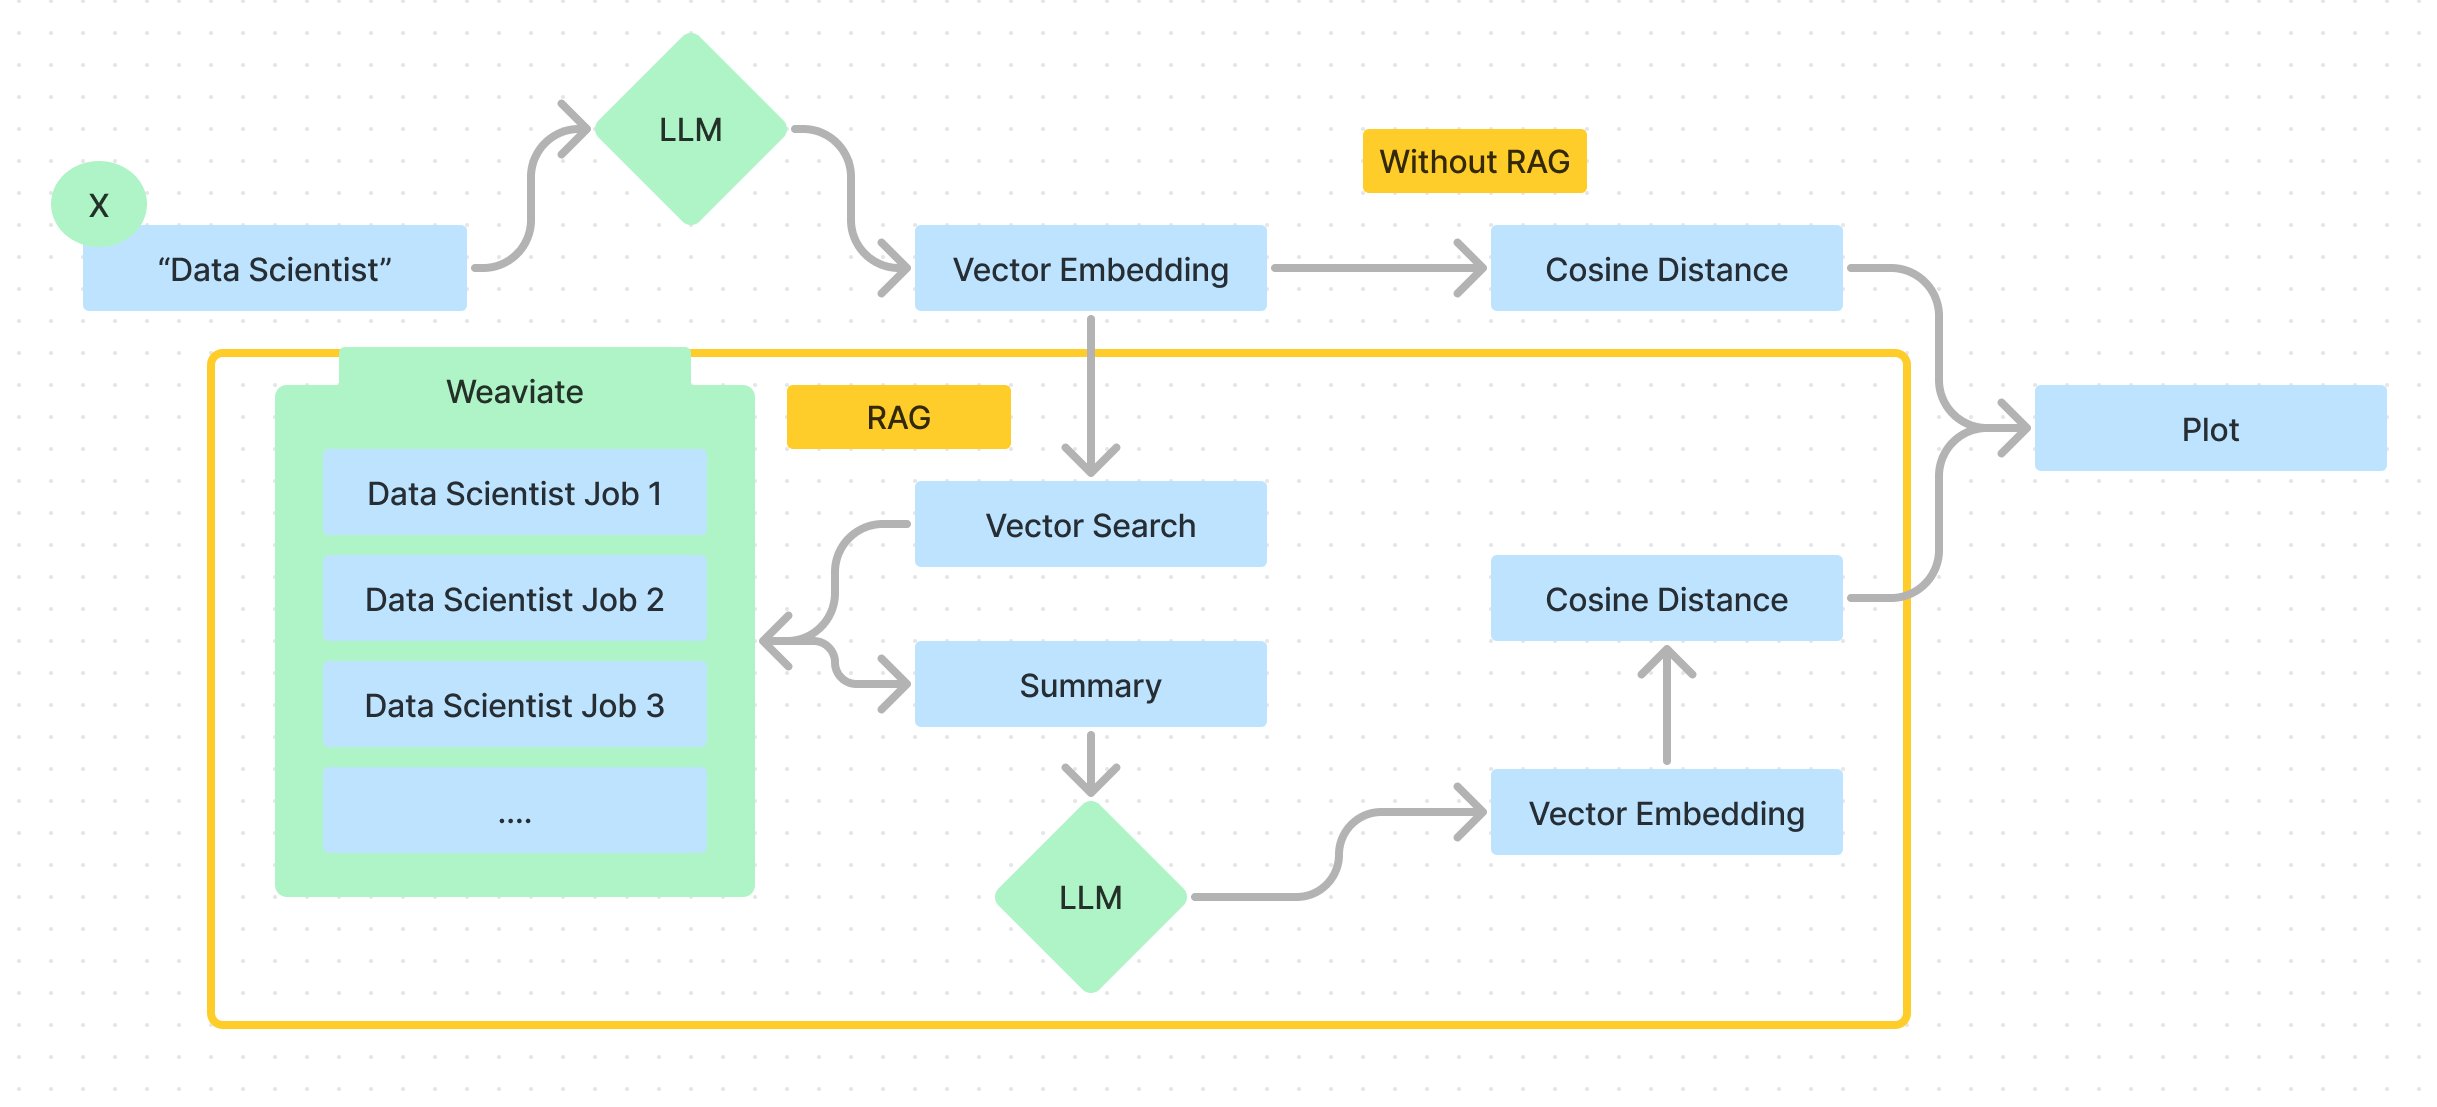
RAG Search
RAG is a technique that enhances large language model’s by providing additional context when querying. In the context this project, RAG add’s in an additional step between our provided axis and their embedding. Here’s a quick representation of how this work’s in this application:
Plot Summary
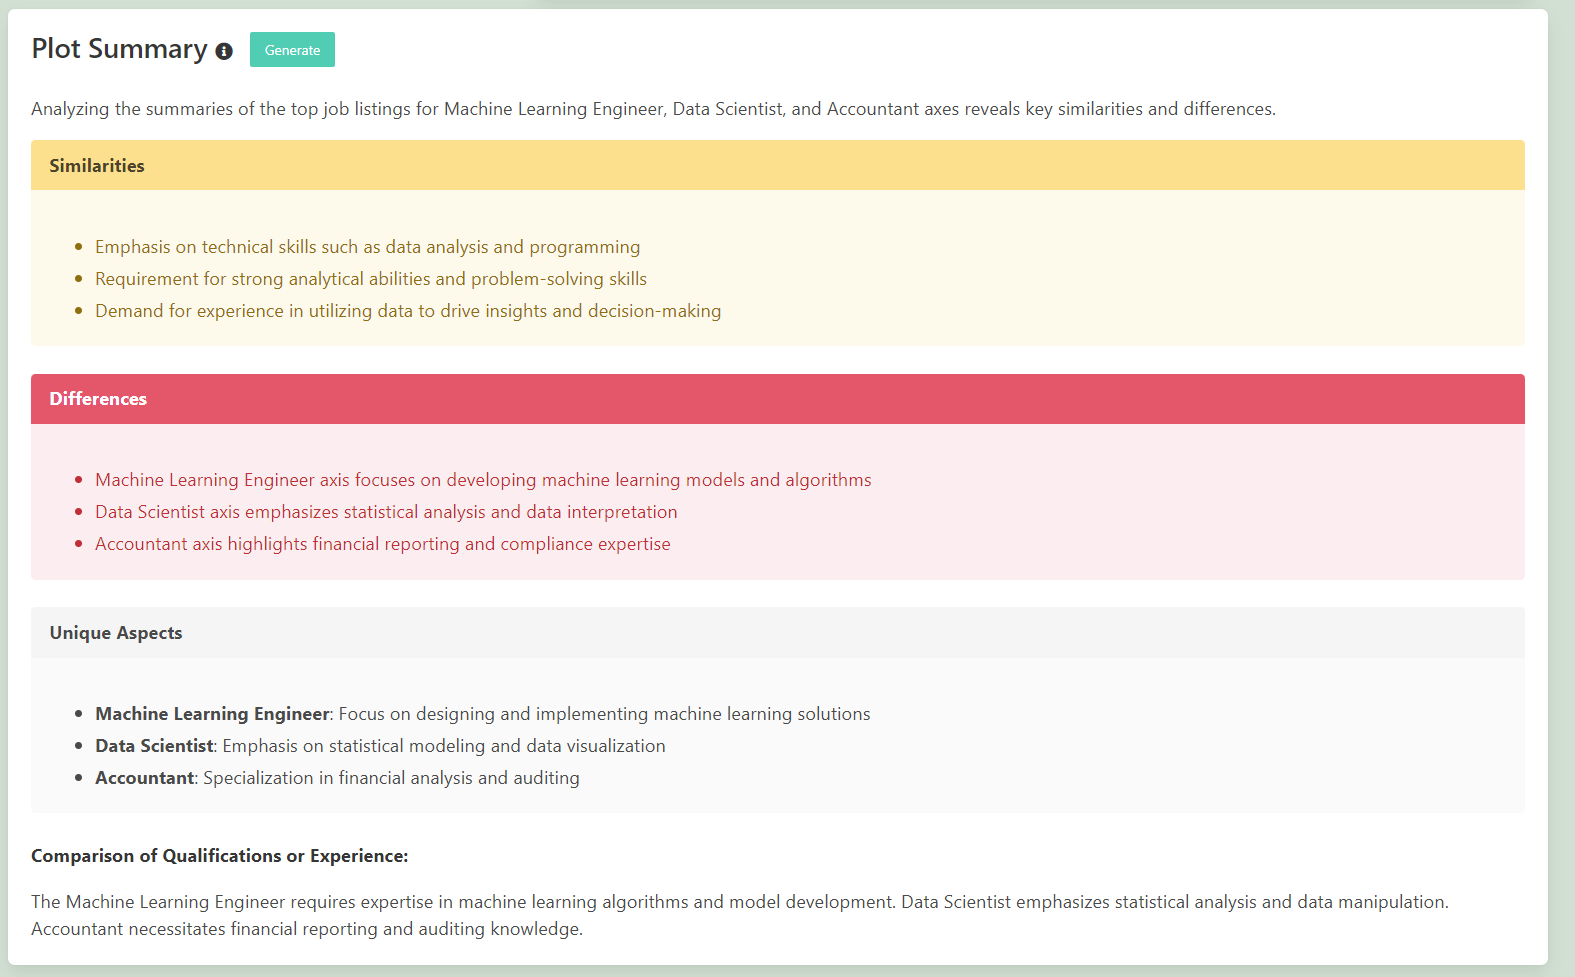
This plot summary is a general summary of the job listings and summarization of the similarities and differences. It works in essentially 3 steps:
- The closest 5 similar job listings are taken and then summarised using Weaviates generative serach.
- These are then aggregating into a meta-analysis prompt using OpenAI 3.5-turbo model.
- This is then output as the inner html to the box.
Axis Alignment
Selecting any point displayed in the 3D Scatter on the main page, a summary comapring the alignment with the 3 provided axis can be generated using and OpenAI call with the RAG queries.
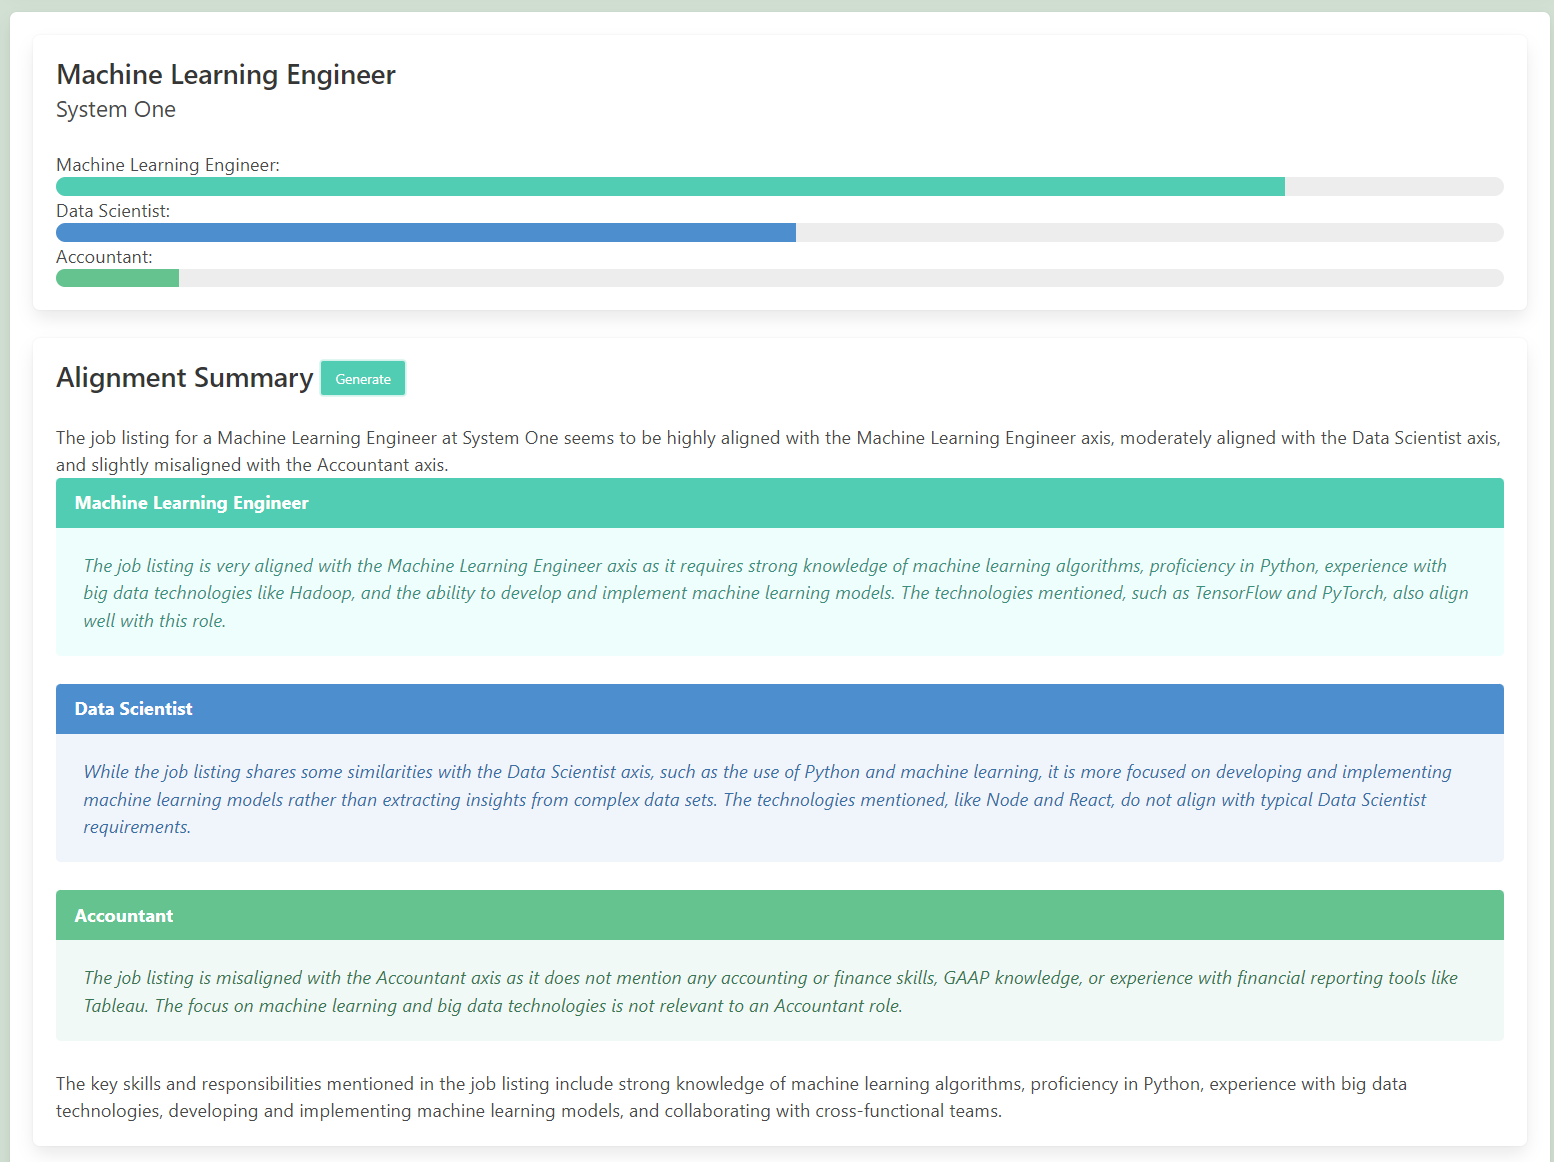
The progress bars up the top are epresent the cosine similarirty between a a job listing point selected on the chart and the 3 axis supplied. The cosine similarity here has been normalised to the range of the range of the cosine similarites in the chart. The raw description can also be access via the box at the bottom of the page.
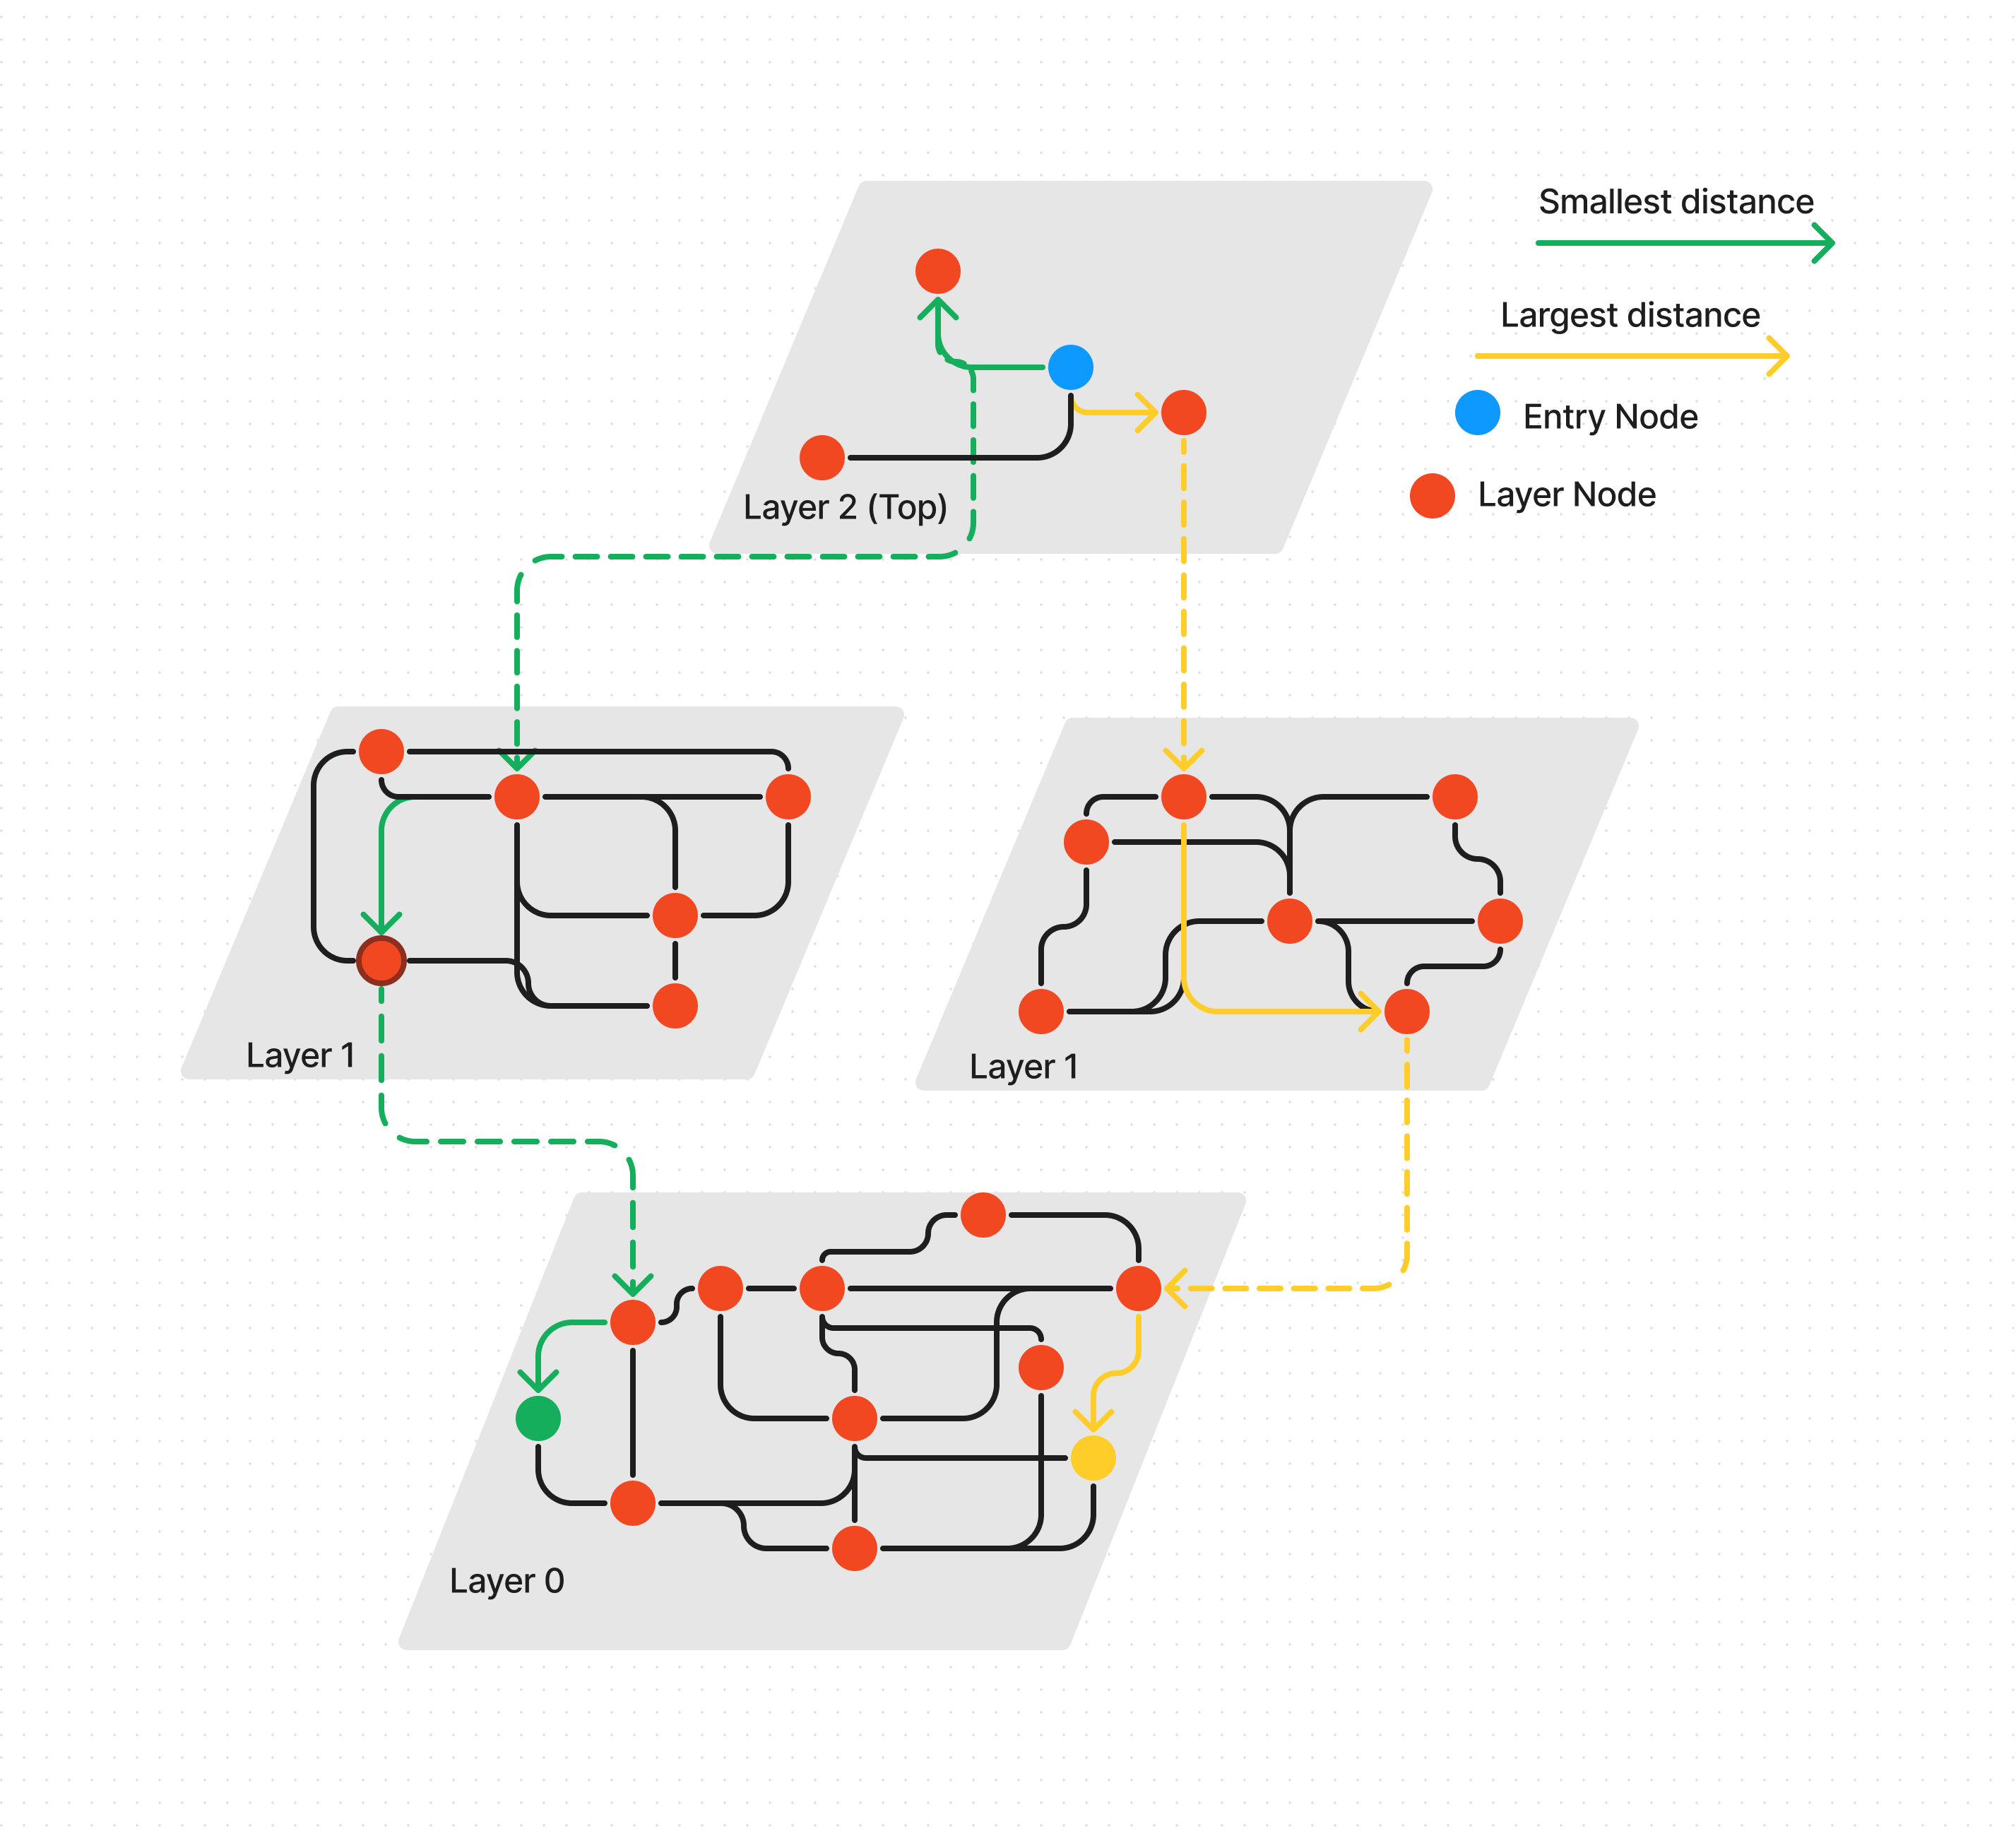
HNSW & ANN
The way that Weavite implemented vector search is by using the Heirachial Navigatable Small Worlds algorithm (HNSW), which is an Approximate Nearest Neighbour (ANN) search alogrithm that works on multi-layered graphs. HNSW provided a very fast, efficient way to approach similarity search, and is one of the reasons why Vector queries are so performative even on very large databases.
One of the challenges we’re faced with in this project is that we want to be able to query our database and not only return results that are very similar to the query, but we want a range of response with varying levels of similarity. This is quite counter-productive to the meaning of ANN, but we can adapt the HNSW framework with some simple modifications to achieve this goal.
BestWorst Search
The goal for best worst search is we need a way to adjust our HNSW search algorithm to be able to control what distance points we are looking for, and return a points across that range. Here’s a quick diagram to explain the funcationality we need:
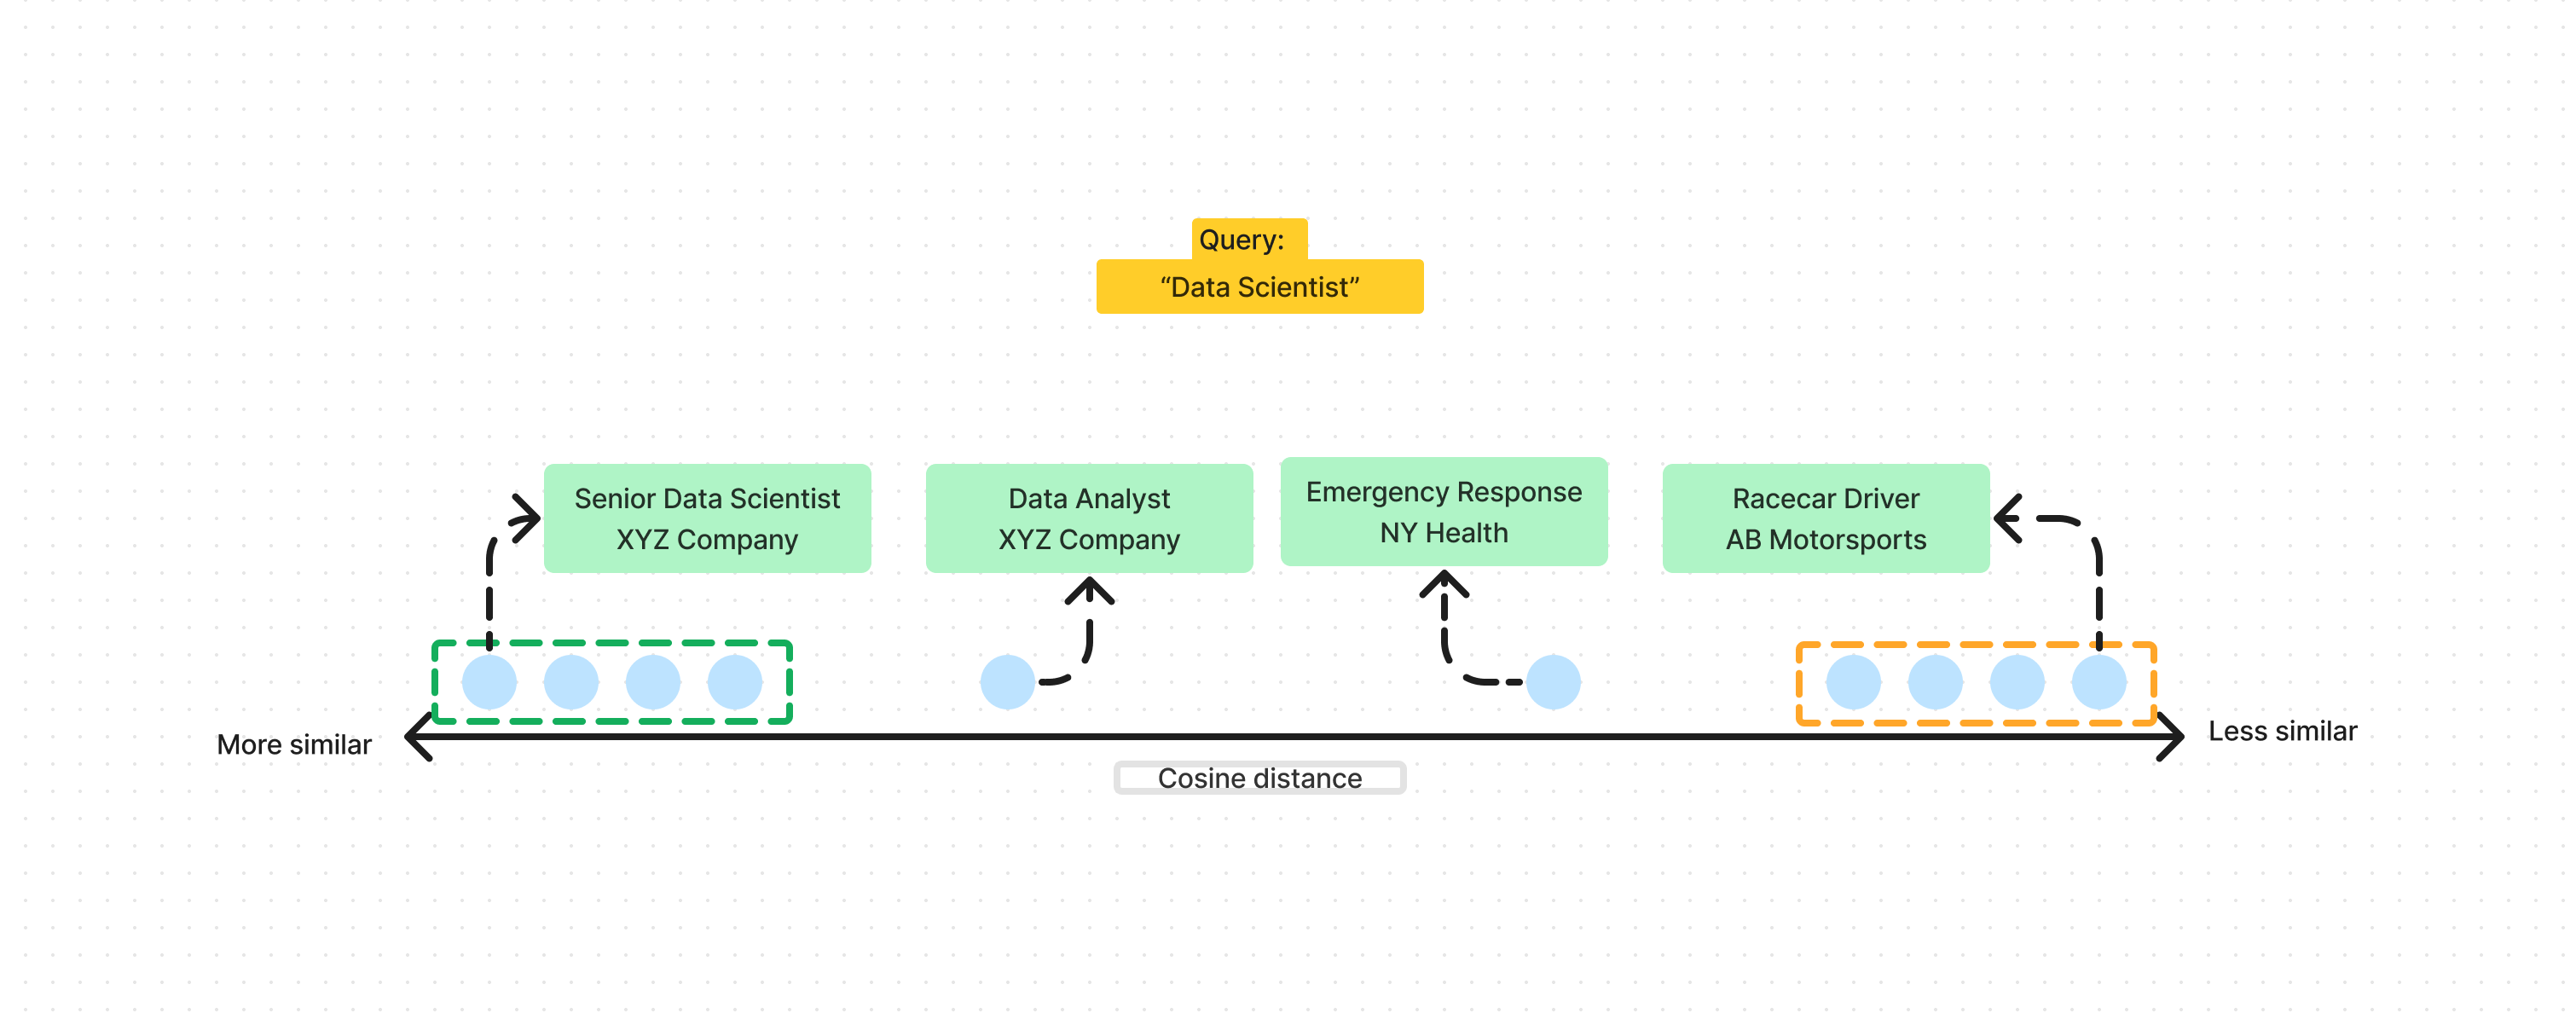
In this diagram we can see that we get a range of results with varying cosine distances, and will provide us with an interseting axis to plot of data on.
The way that this is implemented in this project is by simply adjusting the cosine distance function at query time, to affect the distance metric that HNSW serach is trying to minimize.
    def cosine_distance(self, a, b):
        #Cosine distance is 1 - cosine similarity
        # cos(theta) = (a . b) / (||a|| ||b||)
        cos_sim = np.dot(a, b)/(np.linalg.norm(a)*(np.linalg.norm(b)))
        return 1 - cos_sim

    def adjustable_distance(self, a, b, adj):
        #Same as above but we can vary the distance function
        #Cosine distance range is [0, 2]
        cos_sim = np.dot(a, b)/(np.linalg.norm(a)*(np.linalg.norm(b)))
        out = abs((1 - cos_sim)-adj)
        return out
The two function’s are very similar, the only change is that in the second function, after calculating the cosine distance, a adjustment factor is taken from the distance and then the abosolute value of that is returned.
For example, as the range for cosine distance sits between [0,2], by using an adjustment factor of 2, we’ve reveresed the distance metric. In practice we want to obtain a range of results, and not just the closest and further points. So the search function is defined as:
    def serach_along_axis(self, q, k=None, ef=None, n=5):
        min_vecotrs = self.search(q,k=k,ef=ef,adj=0)
        max_vectors = self.search(q,k=k,ef=ef,adj=2)

        min_dist = min_vecotrs[0][1]
        max_dist = self.vectorized_distance(q,[self.data[x[0]] for x in max_vectors])
        ...
        ...

        distance_range = max_dist[0] - min_dist
        interval = distance_range/n
        for i in range(0,n-1):
            adj = min_dist + interval*(i+1)
Alongside k and ef, which are parameters in the traditional HNSW search process, we also define n which dictates the number of interval to devide the search into.
The basic steps are:
- Find the closest result to your search query using a standard HNSW search
- Find the furthest result using an adjustment factor of 2.
- Get the range of distances between 1 and 2
- Devide that range into
nintervals and use those intervals as an adjustment factor - Return
kpoints from each interval
This process is then repeated for the 2 other axis queries, then once we have all k * n * 3 vectors, we calculate their correct cosine distance’s (no adjustment) from each of the 3 axis, and use this distances to plot the points on a 3D Scatter using Plotly
The main drawback from this approach is that this HNSW funcationality is implemented in Python and not using Weaviate. This means that 2 HNSW graphs will have to be created, the original one in Weaviate, then the vectors are downloaded and an offline HNSW graph is created using python. In the offline graph the uuid from Weaviate, and this is used to reference back to Weaviate for other functionality in the website. Here’s a simple diagram to explain the process:
Technologies Used
- Python
- Django web framework
- HTML, CSS, JavaScript
- Plotly for interactive visualizations
- OpenAI API for generating embeddings
- Hierarchical Navigable Small World (HNSW) algorithm for efficient similarity search
- Weaviate for vector storage and retrieval
Features
- Semantic analysis on job postings related to AI and Machine Learning
- Interactive 3D visualization of job data based on user-defined keywords
- Customizable axis labels for data exploration
- Real-time updates and dynamic plot generation
- Detailed job summary and alignment analysis
- User-friendly interface with modern design